Thursday, January 10, 2019

BIG DATA WEEK: ZoLa Show and Tell.

We're back on the ZoLa again!  

Scroll down the feature menu to the very bottom under  Basemaps and check the 3D feature, then check the Aerial Imagery box and you can choose any one of 11 different years dating all the way back to 1924 and as recently as 2016.  

Over the years, we've covered a lot of new development in the South Slope.  Here's one that we spent a good deal of time with...Lake Windsor a.k.a. 1638 Eighth Avenue, located between Windsor Place and Prospect Avenue. ZoLa offers us a chance to show off the property's unique, elongated land-locked lot over the history of development.    
In the year 2001,  1638 8th Avenue was a single story commercial warehouse with a driveway entrance on 8th Avenue.  There was a very large rear yard that extended down the block between Windsor and Prospect.


In 2006 the building was demolished to make way for a multifamily development.

ZoLa's 3D mapping feature allows you to define current as built mass.

You can tilt and rotate your viewpoint.  1638 8th Avenue as seen from 8th Avenue.


1939-1940 Tax photo of 1638 8th Avenue from the NYC  Municipal Archives. Over the years the property functioned as an office?garage for a home heating fuel oil delivery company.  Old timers say that's where they would buy their block of ice for their home iceboxes.  In 1922 ice plants in NYC and Long Island electrically manufactured over 1 million tons of ice, with an additional 20 tons of ice still being naturally harvested.


ZoLa Pretty Data: New York City's Zoning and Land Use Beta Beauty


NYC Civic Technologists and Open Source Social Coders producing vibrant interactive maps and data visualizations that we here at IMBY Labs find optically arousing.  The next generation of WEB MAPPING technology allows us to tilt, zoom, and rotate to our heart's content.  Add this to your box of hammers.  Clik for link  
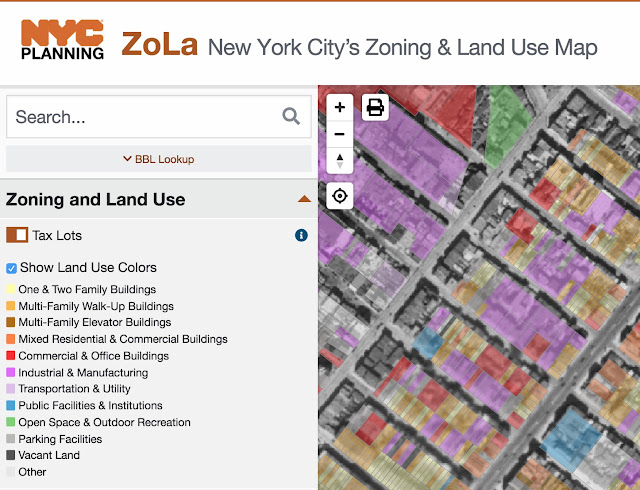
ZoLa: NYC Planning and Land Use Map  

What you got planned? 
Weave your own layered BIGDATA tapestries.
Start with a base warp map of Zoned Building FootPrints, Aerial Imagery or 3D Building Masses then layer on the weft Districts...Residential, Commercial, Manufacturing, Community, Assembly, Senate, Council, Business Improvement, Limited Height, Historic.
Bedazzle it up on over the top with Flood Insurance Rates, Mandatory Inclusionary Housing Areas, Outdoor Sidewalk Cafe requirements and Transit Zones.  Don't forget to check the box "Show Land Use Colors".